- Azure
- Azure Container Apps
- Terraform
In this tutorial you will deploy Azure Managed Grafana to monitor your Azure Container Apps defined in the previous tutorial. The source code is available in this Github repository.
This tutorial is part of a full series of tutorials on using Azure Container Apps with Terraform.
Configure your Azure subscription
Before you can deploy Azure Managed Grafana, you need to configure your Azure subscription to use it. To do that, you need to register the Microsoft.Dashboard resource provider.
To register the Microsoft.Dashboard resource provider, you can use the Azure CLI:
# Register
az provider register --namespace 'Microsoft.Dashboard'
# Check the registration status
az provider show -n Microsoft.Dashboard
Deploy Azure Managed Grafana
Deploying Azure Managed Grafana is pretty straightforward. You just need to add the following resource to your Terraform definition:
resource "azurerm_dashboard_grafana" "this" {
  name                              = format("amg-%s", local.resource_suffix_kebabcase)
  resource_group_name               = azurerm_resource_group.this.name
  location                          = azurerm_resource_group.this.location
  api_key_enabled                   = false
  deterministic_outbound_ip_enabled = false
  public_network_access_enabled     = true

  identity {
    type = "SystemAssigned"
  }

  tags = local.tags
}
Configure Azure Managed Grafana
To be able to access the Azure Managed Grafana instance, you need to manage identities. In fact, you need to give the Grafana Viewer, Grafana Editor and Monitoring Reader role to the Azure Managed Grafana instance.
To do that, create a new file called roles.tf and add:
resource "azurerm_role_assignment" "grafana_viewer" {
  scope                = azurerm_resource_group.this.id
  role_definition_name = "Grafana Viewer"
  principal_id         =  azurerm_dashboard_grafana.this.identity[0].principal_id
}

resource "azurerm_role_assignment" "grafana_editor" {
  scope                = azurerm_resource_group.this.id
  role_definition_name = "Grafana Editor"
  principal_id         =  azurerm_dashboard_grafana.this.identity[0].principal_id
}

resource "azurerm_role_assignment" "monitor_reader" {
  scope                = azurerm_resource_group.this.id
  role_definition_name = "Monitoring Reader"
  principal_id         =  azurerm_dashboard_grafana.this.identity[0].principal_id
}
And for each users you want to give access and ability to configure the Azure Managed Grafana, you also need to give the Grafana Viewer, Grafana Editor and Monitoring Reader role.
In your locals.tf file, declare a list of user identities:
users_identities = ["USE-YOUR-OWN-IDENTITY-HERE"]
Then go back to the roles.tf file and add the following resource:
resource "azurerm_role_assignment" "users_grafana_viewer" {
  for_each             = toset(local.users_identities)
  scope                = azurerm_resource_group.this.id
  role_definition_name = "Grafana Viewer"
  principal_id         = each.key
}

resource "azurerm_role_assignment" "users_grafana_editor" {
  for_each             = toset(local.users_identities)
  scope                = azurerm_resource_group.this.id
  role_definition_name = "Grafana Editor"
  principal_id         = each.key
}

resource "azurerm_role_assignment" "users_monitor_reader" {
  for_each             = toset(local.users_identities)
  scope                = azurerm_resource_group.this.id
  role_definition_name = "Monitoring Reader"
  principal_id         = each.key
}
Run Terraform
It’s now time to deploy the Azure Managed Grafana. Just run Terraform plan command and apply it:
terraform plan --out=plan.out
Then:
terraform apply plan.out
Access and configure Azure Managed Grafana
Go to the Azure portal and into the Azure Managed Grafana instance with one of the users you gave access to. Then let’s configure it by adding these two dashboard:
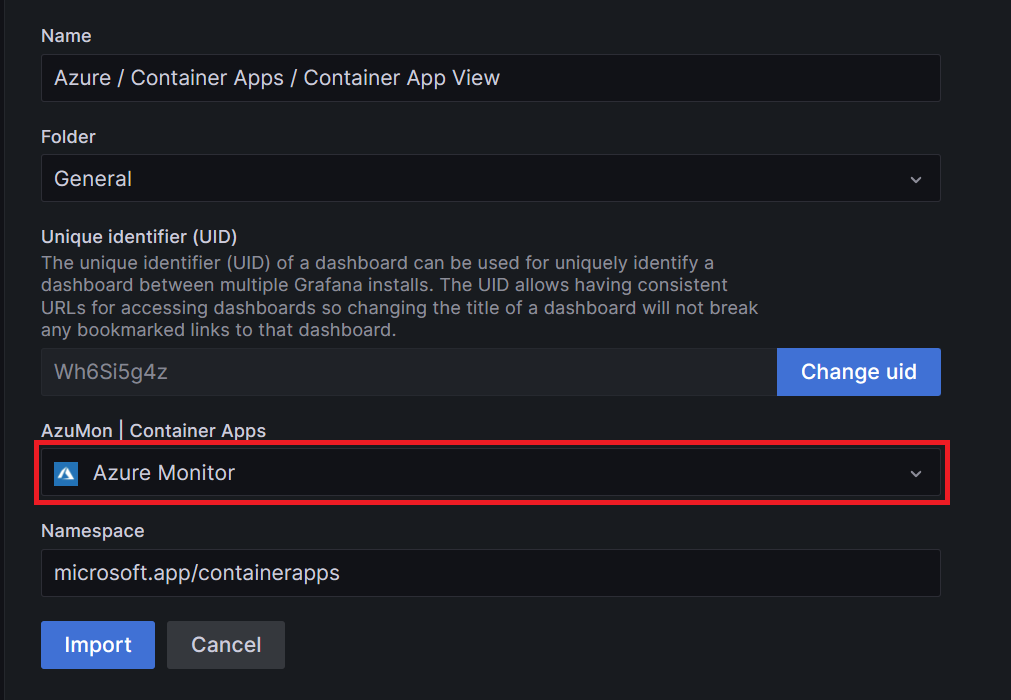
To do that, in the left panel click on Dashboard and then import. Copy paste the url and click on Load. Then select Azure Monitor and click on Import.
Repeated the operation for the second dashboard.
Now, if you navigate to the first dashboard you will see the list of your containers apps:
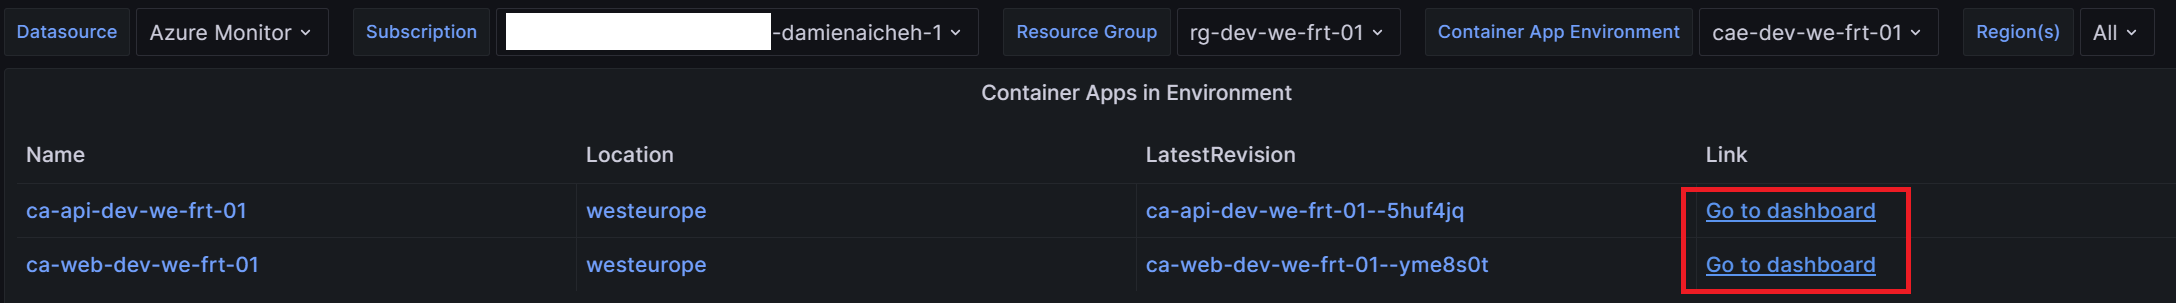
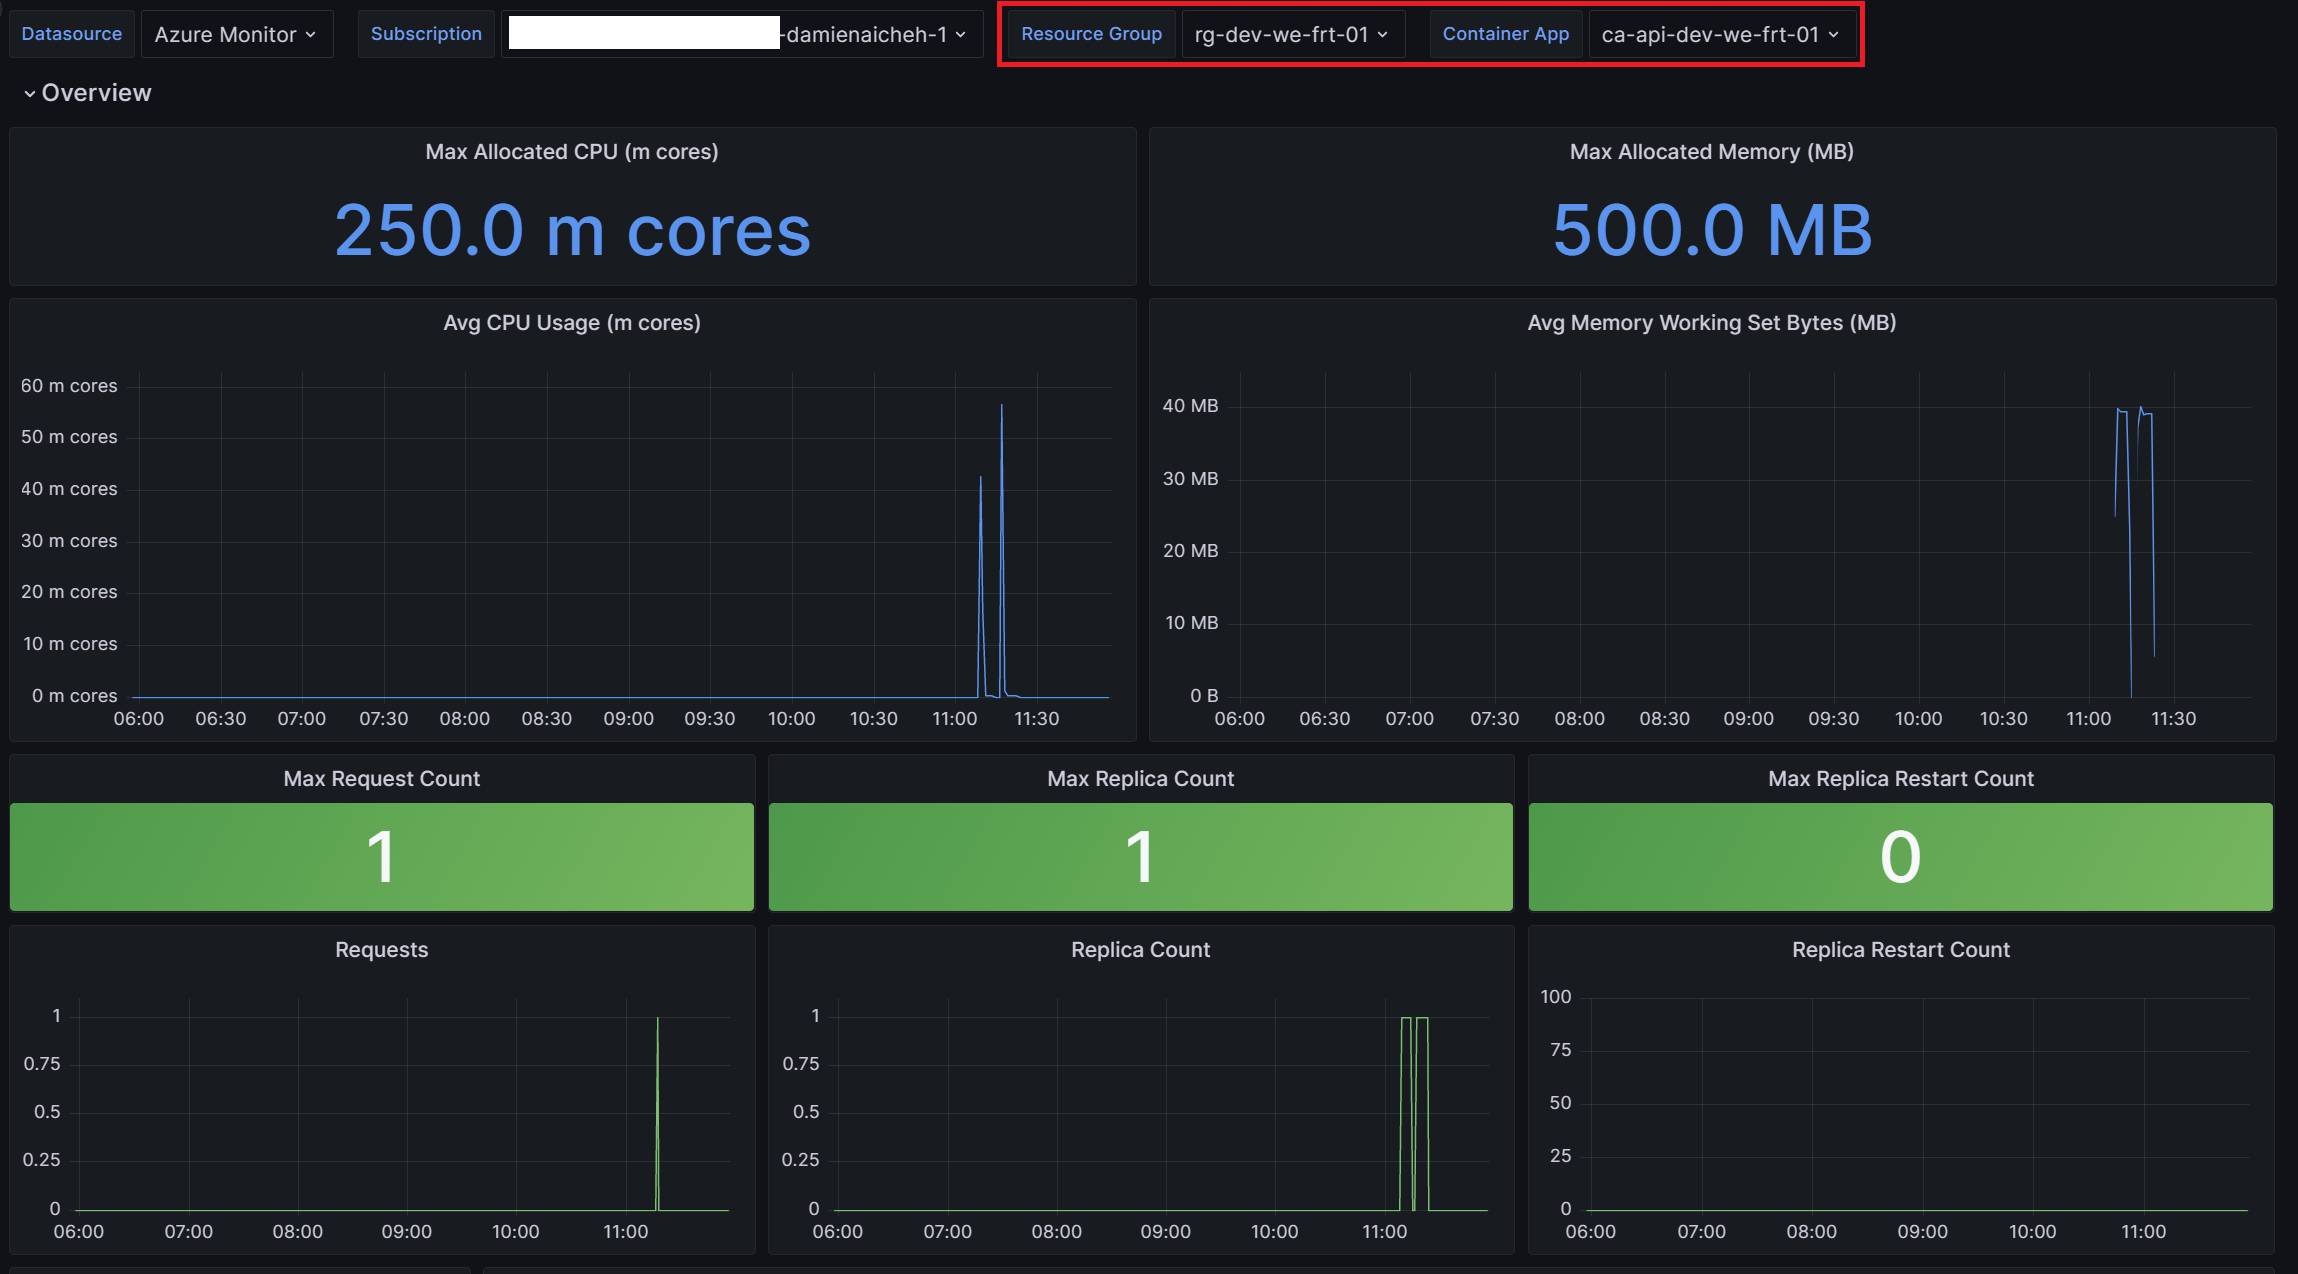
And if you click on one, you will be redirect to the second dashboard to see the details of the container app:
Final touch
The Azure Managed Grafana instance is deployed and configured. You can now start to monitor your Azure Container Apps. You will find the complete source code in this Github repository.